As the 2016 presidential election season draws closer, one topic which will receive attention is income inequality. A fairly simple metric of income inequality is the Gini index, which is a rich and meaningful source of data and skill building exercises for students of mathematics and economics. The Gini index is a number which can be derived from a Lorenz curve. A Lorenz curve, typically denoted L(x), represents the cumulative fraction of total income earned by the bottom fraction x of income earners. Both x and L(x) are expressed as fractions in the interval [0, 1]. If everyone earned the same amount (complete income equality) then L(x) = x. In no country on earth does this income equality exist; however, some countries have more equality than others. In the case of almost all nations the Lorenz curve resembles generically the one shown below. The Lorenz curve for the US for 1989 looks like this.
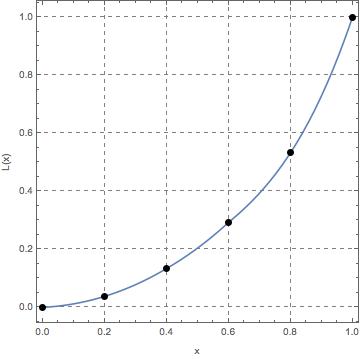
Lorenz curve for US for 1989 (source).
The Gini index of income inequality is calculated as twice the area between the diagonal line defined as y = x and the Lorenz curve L(x). Thus the Gini index of a nation with complete income equality would be 0 and at the other extreme the Gini index of a nation with complete income inequality would be 1. The closer to 0 the Gini index is for a country, the more income equality that country has. The closer to 1 the Gini index is for a country, the more income inequality exists in that country. For instructors and students in calculus, calculation of the Gini index is a real-world example of the application of the definite integral. For instructors and students in numerical analysis, mathematical modeling, statistics, developing the Lorenz curve and Gini index from raw data is a nontrivial exercise in curve fitting. So where does the US rank in terms of income inequality? Namibia and South Africa are among the most inequitable countries in terms of income distribution (Gini indices of 0.707 and 0.650 respectively). Sweden and Denmark are at the top of a ranking of countries according the income equality (Gini indices of 0.230 and 0.240 respectively). The US is near the middle (Gini index 0.480) keeping company with China (0.470) and Russia (0.415). However, income inequality has been on the rise in the US since at least the late 1960's (the oldest data I was able to access online easily). A year by year plot of the US Gini index from 1967 to 2014 is shown below.

A measure of historical income inequality in the US (source).
References
C. Gini, Variabilita e mutabilita, Gini, C. (1912), C. Cuppini, Bologna, 1912; reprinted in Memorie di metodologica statistica (Edited by E. Pizetti, T. Salvemini), Libreria Eredi Virgilio Veschi, Rome, 1955.
C. Gini, Sulla misura della concentrazione e della variabilita dei caratteri, Atti del R. Istituto Veneto di Scienze, Lettere e Arti LXXIII parte II (1914) 1203–1248; reprinted in English: On the Measurement of Concentration and Variability of Characters, Metron LXIII (2005) 3–38, available online.
T. Jantzen and K. Volpert, On the Mathematics of Income Inequality: Splitting the Gini Index in Two, American Mathematical Monthly, Vol. 119, no. 10 (2012) 824-837, available online.
M.O. Lorenz, Methods of measuring the concentration of wealth, Publications of the American Statistical Association, Vol. 9 New Series, no. 70 (1905) 209–219, available online.